Visualization
Chaos scenario visualization constitutes an integral part of the system observability during chaos in Litmus.
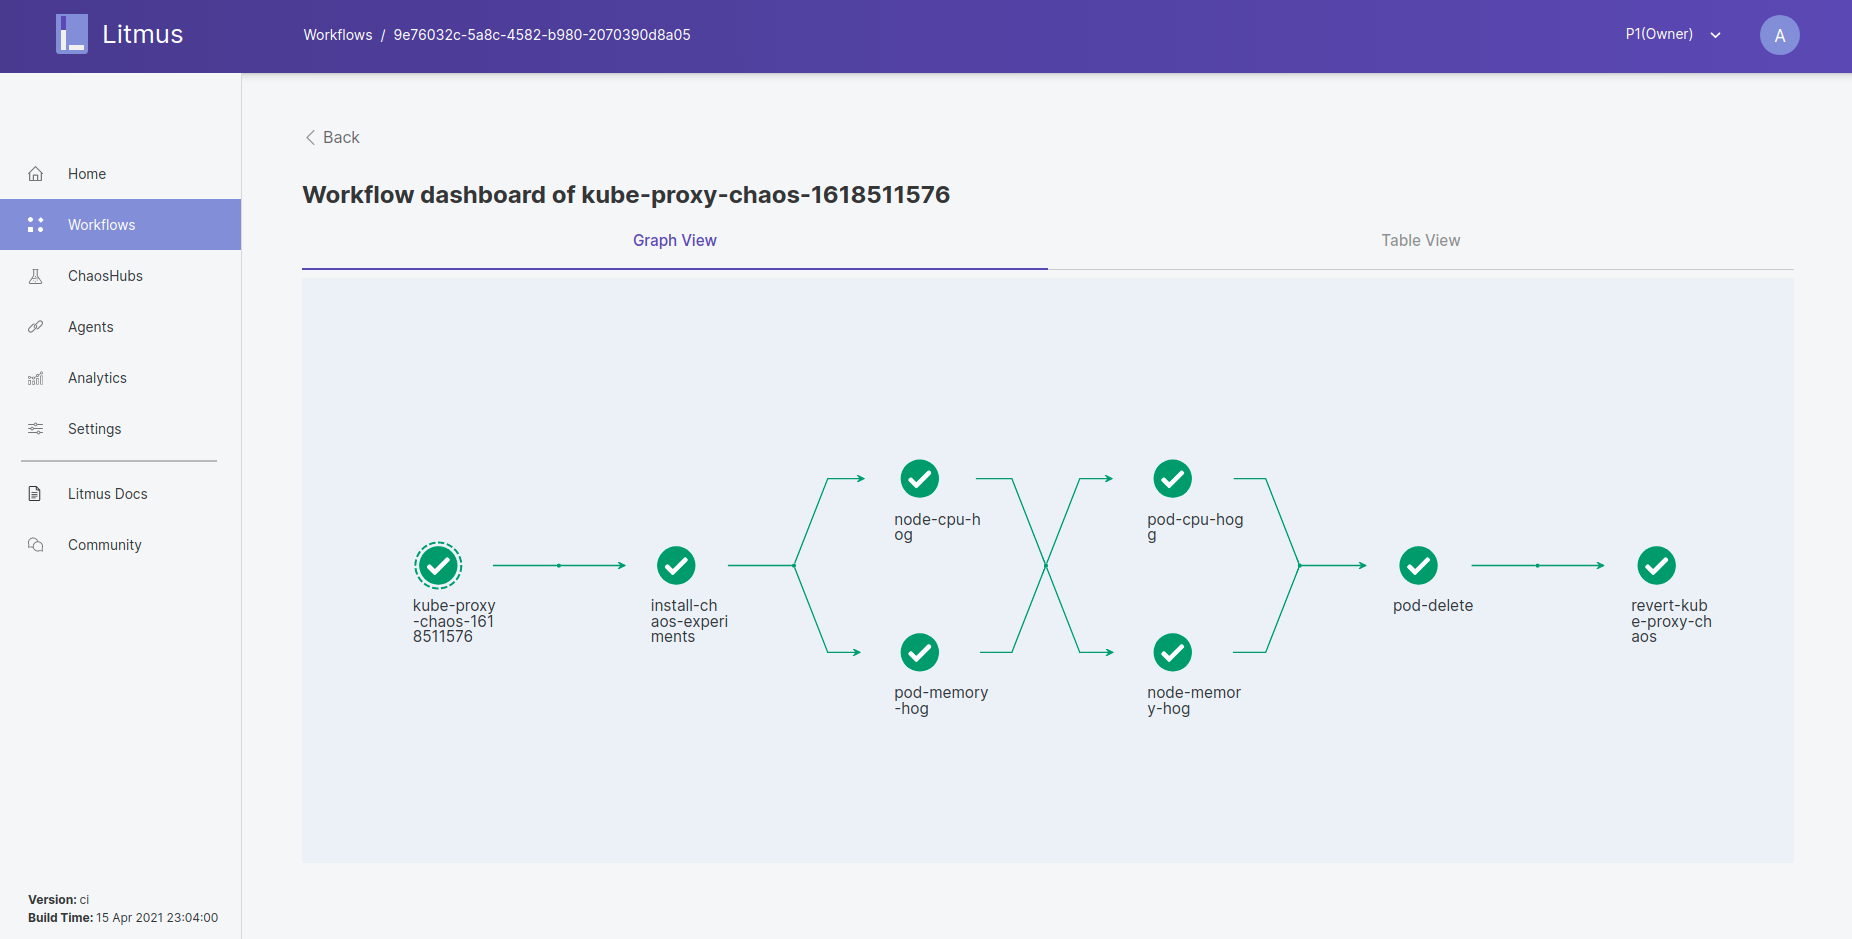
- It is a visual representation of the steps performed as part of the Chaos Scenario CR execution.
- Every step is represented as a node, which also depicts the status of the respective node that it represents.
- All the nodes are connected in a sequential order to account for the order of execution of the respective steps.